# Monitoring HStreamDB with Grafana
A comprehensive metrics visualisation of the deployed HStreamDB cluster makes it easier to analyse the status and diagnose problems. This document describes the deployment of Grafana and related tools with a running HStreamDB instance.
# Installations and Set-up
# Setup Data Source for Grafana (Setup HStream Http Server and Prometheus)
Download the HStream HTTP Server binary from the release page (opens new window).
Start the HTTP Server with
http-server -services-url "127.0.0.1:6570" -address "127.0.0.1:9290"
as a dependency of HStream Metrics Exporter. The HTTP Server will be responsible for collecting metrics and executing admin requests.
Setting up HStream Metrics Exporter is similar. Usages and releases are available on its homepage (opens new window).
hstream-metrics-exporter -host 127.0.0.1 -port 9270 -http-server-host 127.0.0.1 -http-server-port 9290
This exports the metrics to Prometheus as a Prometheus target.
Another Prometheus target we need is the Node Exporter, an exporter for hardware and OS metrics. It should be deployed on every HStream node. Information about the installation and usage is available on its homepage (opens new window).
After setting up the targets, users can start Prometheus via Docker with configuration files.
docker run -p 9090:9090 -v /path/to/prometheus.yml:/etc/prometheus/prometheus.yml prom/prometheus
The configuration files must set scrape intervals and configure HStream Metrics Exporter as the target. We would also need the HStream Metrics Exporter's address in the Prometheus configuration. Check the Prometheus guide (opens new window) for details.
# Install and Start Grafana
We can install and run Grafana with Docker
docker run -p 3000:3000               \
  -e GF_AUTH_ANONYMOUS_ORG_ROLE=Admin \
  -e GF_AUTH_ANONYMOUS_ENABLED=true   \
  -e GF_AUTH_DISABLE_LOGIN_FORM=true  \
      grafana/grafana-oss
2
3
4
5
Here are a few options making just having a preview of monitoring HStreamDB easier.
GF_AUTH_ANONYMOUS_ORG_ROLE=Admin: enable anonymous organisation as Grafana admin, which is able to add data sourcesGF_AUTH_ANONYMOUS_ENABLED=true: enable and use an anonymous organisation as the defaultGF_AUTH_DISABLE_LOGIN_FORM=true: make the above two options work and skip the log-in screen
# Provision Grafana
To start with, create a folder with the following hierarchy:
provisioning/
├── dashboards/
└── datasources/
2
3
When run with Docker, use -v <path-to>/provisioning:/etc/grafana/provisioning to mount the file into the container.
Create datasources.yml under the datasources folder to provision data sources.
An example would be:
apiVersion: 1

datasources:
  - name: Prometheus
    id: 1
    uid: TNX2D3rnk
    orgId: 1
    type: prometheus
    typeName: Prometheus
    typeLogoUrl: public/app/plugins/datasource/prometheus/img/prometheus_logo.svg
    access: proxy
    url: http://localhost:9090
    password: ""
    user: ""
    database: ""
    basicAuth: false
    isDefault: true
    jsonData:
    httpMethod: POST
    readOnly: false
2
3
4
5
6
7
8
9
10
11
12
13
14
15
16
17
18
19
20
Create dashboards.yml under the dashboards folder to provision dashboards.
An example would be:
apiVersion: 1

providers:
  - name: "DS_PROMETHEUS"
    orgId: 1
    folder: ""
    type: file
    disableDeletion: false
    updateIntervalSeconds: 10
    allowUiUpdates: true
    options:
      path: /etc/grafana/provisioning/dashboards
      foldersFromFilesStructure: true
2
3
4
5
6
7
8
9
10
11
12
13
The path field here is the path Docker options bound to, for example, /etc/grafana/provisioning. Grafana will treat all JSON files in the path folder as dashboards, which will be imported on start-up. Dashboards created later can also be exported to JSON files.
# Query Metrics and Create Dashboards with Grafana
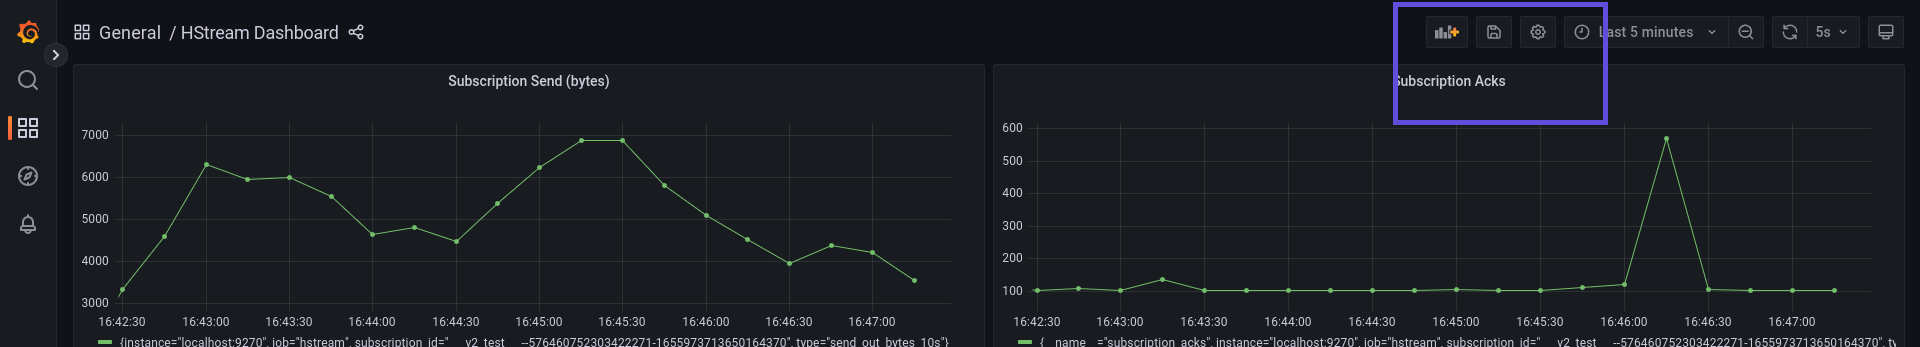
With services all set up, we can now run metrics queries and visualise data with Grafana.
The following creates a new metrics panel on the Dashboards tab:
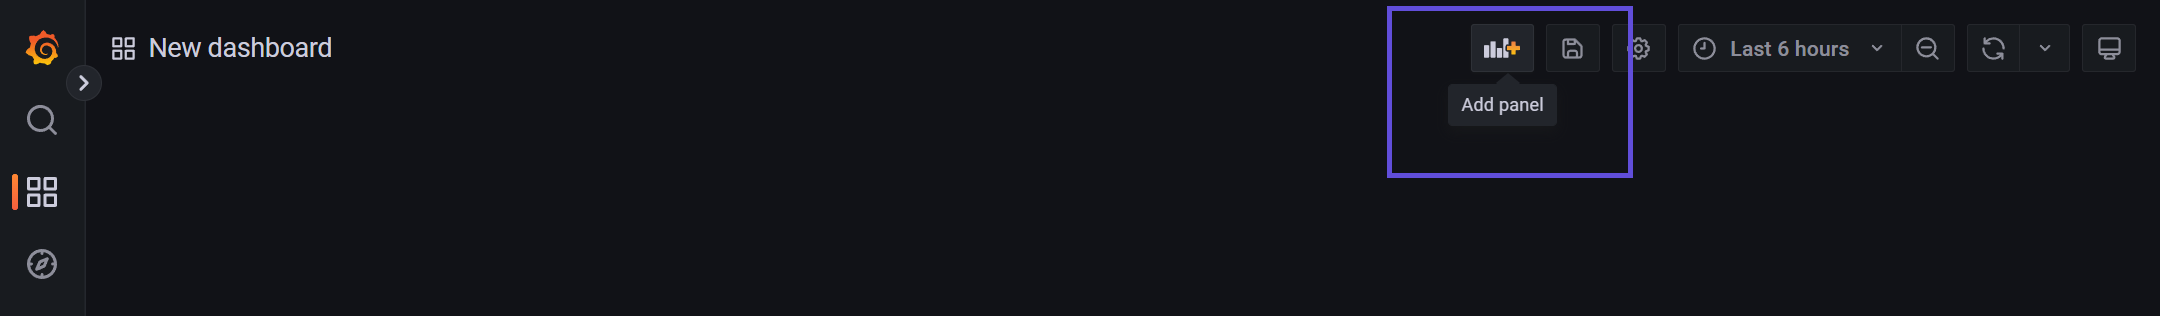
Click on "Add panel":
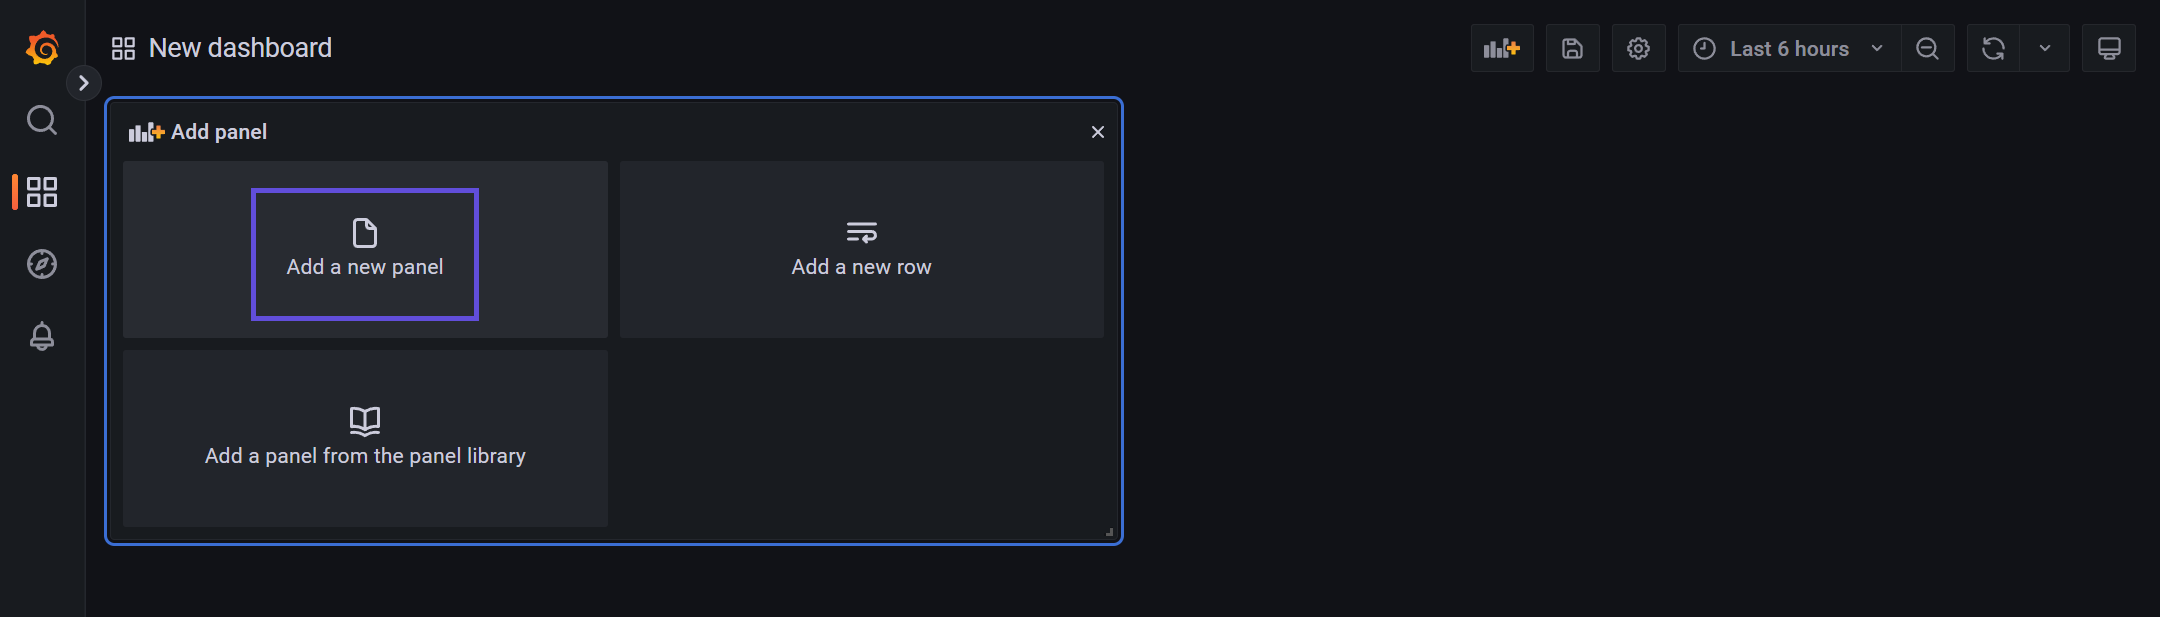
Click on "Add a new panel":
Under the "Query" tab, use the metrics explorer under the "Metrics" tab to select the HStream Metrics, for example, we have chosen append_in_bytes. Use the query builder to construct the query and provide attributes. Then save the new panel.
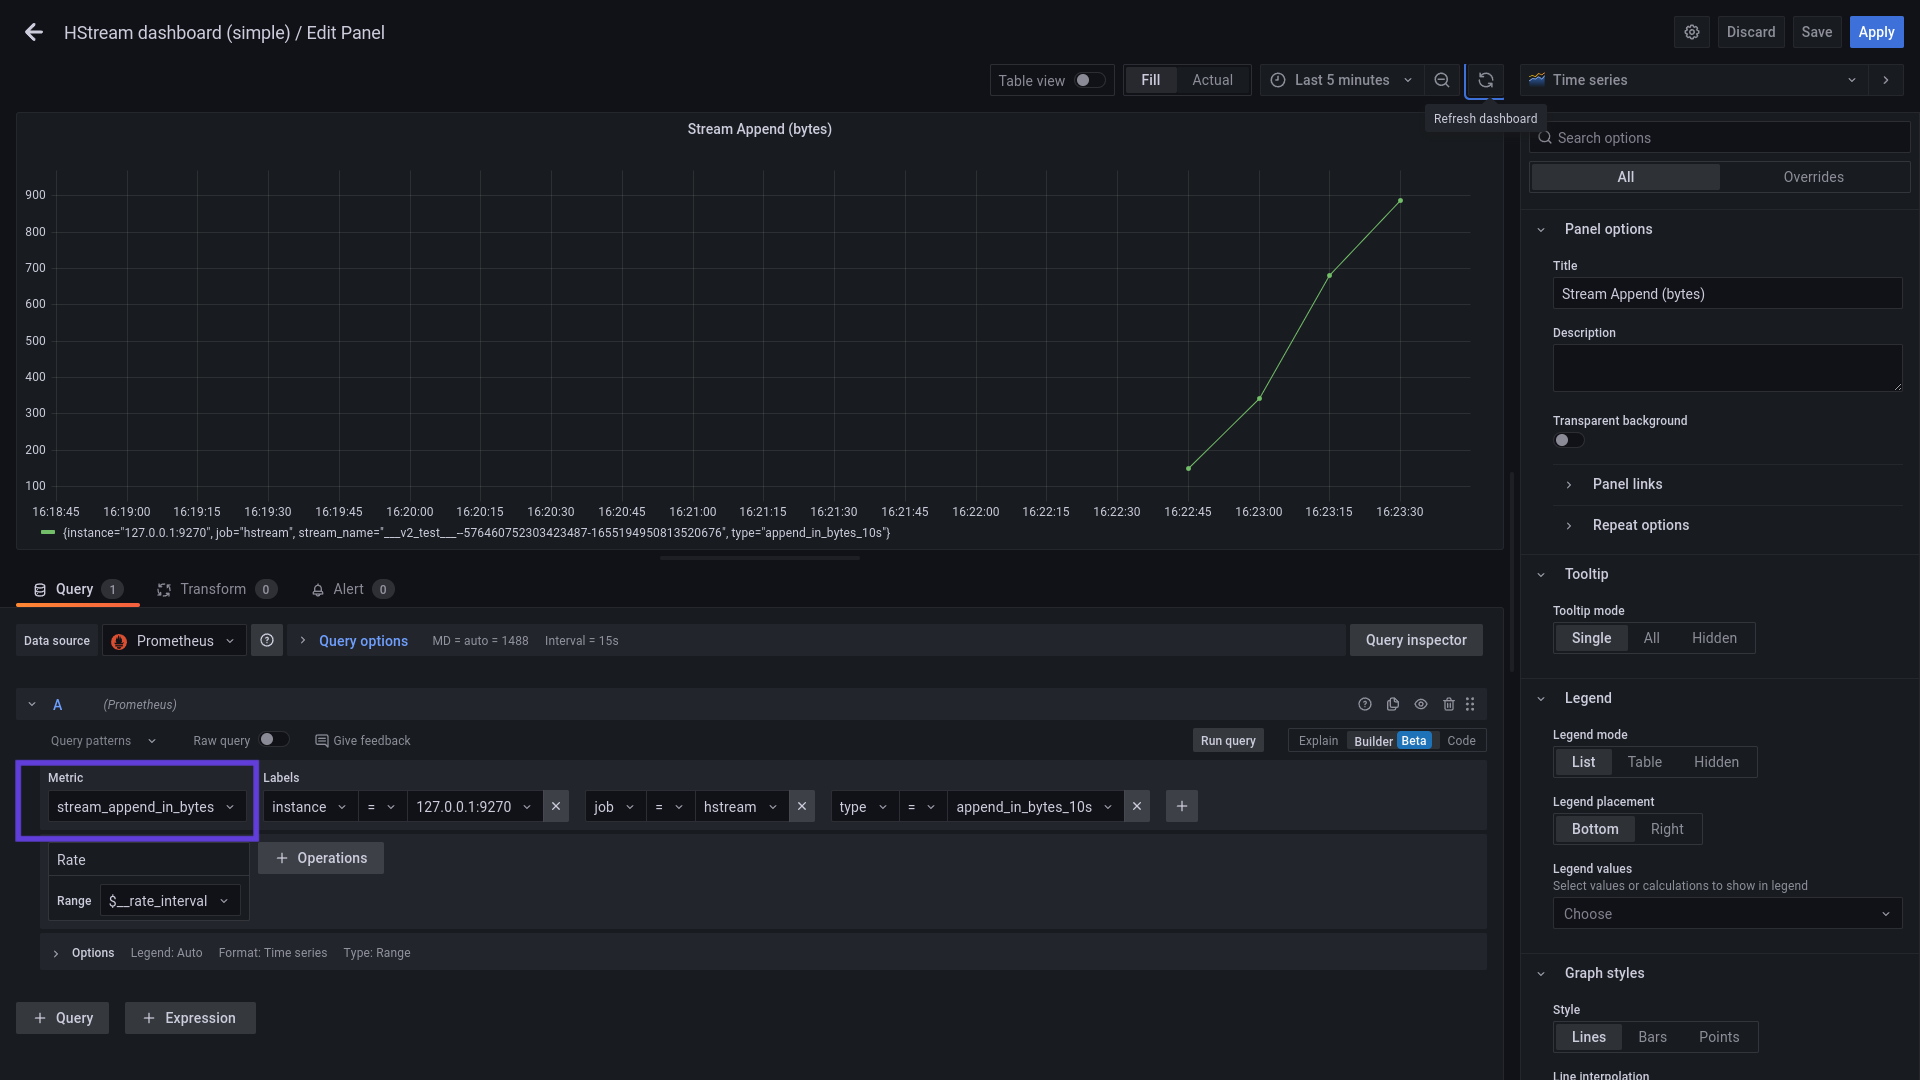
Click on "Save dashboard", then export as JSON for provisioning and import usages.